Meter management,
automated.
A complete energy monitoring system: electricity, gas and water meters, from reading to replacement. The phone reads the meter; the data is in your portal before the technician leaves the building.

Holiday parks and property managers: every reading includes a photo, helping you support tenant and owner recharges.
The process works.
You just pay for it again every month.
Most organisations have a process for collecting readings. But without automation, the same friction keeps coming back — across every location, every month.
Every site has its own process
Even with instructions in place, each site adapts them differently. The data arrives in different formats, at different times, with different levels of detail. Before anyone can use it, someone has to make it consistent first.
The data always describes last month
Readings arrive on the site’s schedule, not yours. By the time the number reaches you the month has closed — and if a consumption has run away in the meantime, it has been running for weeks.
Errors slip through undetected
A wrong digit, a decimal in the wrong place, a value lower than last month — without automated checks, these go straight into your reports. By the time something looks wrong, it is already too late.
From site to head office, automated.
Snapmeter handles every step — from the reading on site, to the data in my.snapmeter.app, and on into your own systems. No manual entry, no chasing, no consolidation.
The app identifies the meter and reads the value
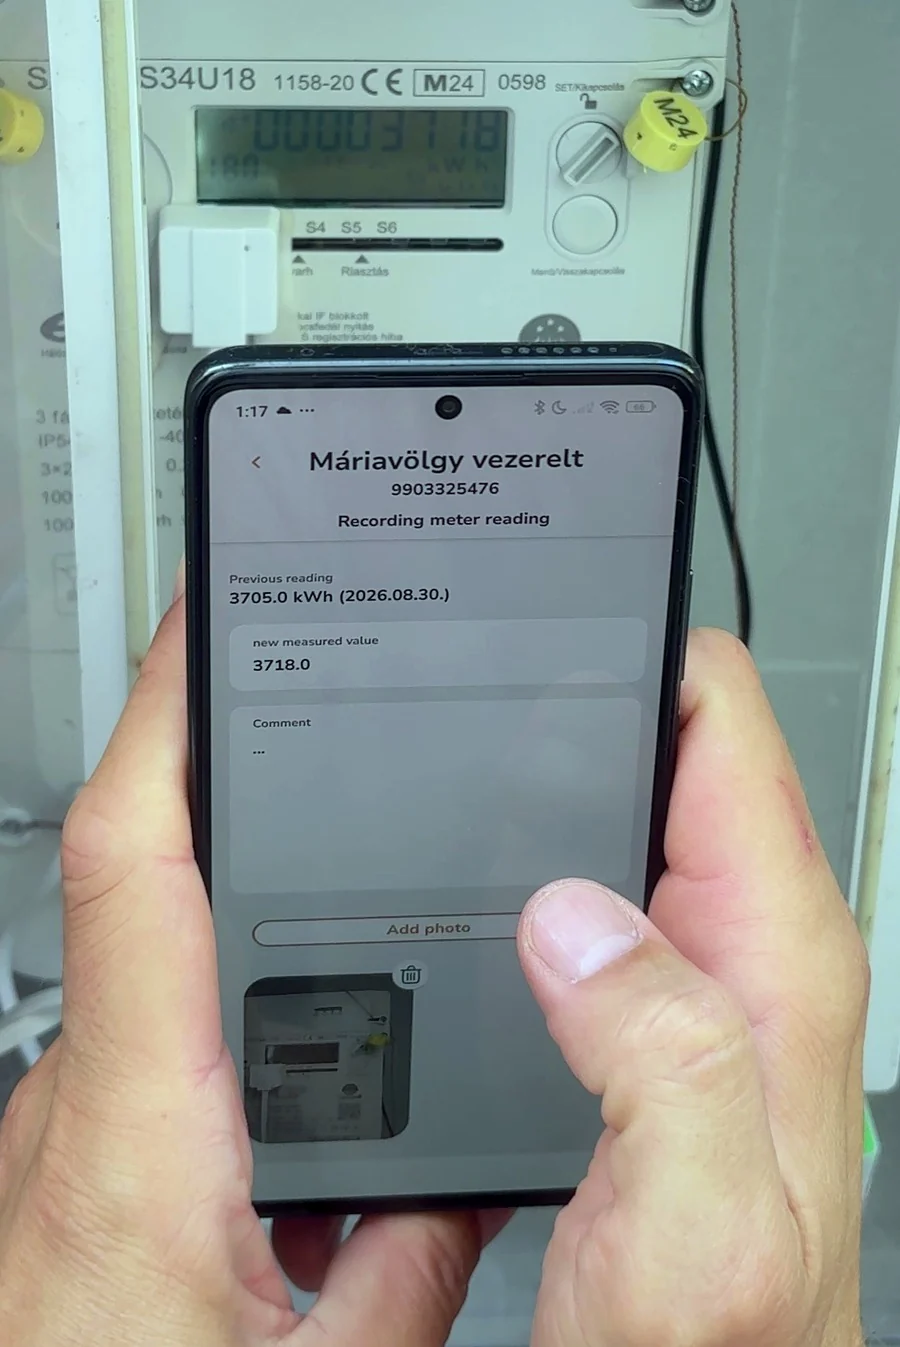
Staff point the phone at the meter. Snapmeter works out which meter it is, reads the value, and flags it before submission if the number does not fit the history.
The reading lands in the portal at once
The moment it is submitted it appears in my.snapmeter.app — timestamped, with a photo, every site in a single view. No waiting for the monthly consolidation, and nobody to chase.
The data continues to where the work happens
SAP, Power BI, Tableau, Metabase — or plain CSV and XLSX export. The number arrives in the report your team already uses; nobody has to learn a new dashboard.
my.snapmeter.app — where the data becomes usable.
This is where the system becomes energy monitoring. A reading is only raw material. The portal is where it turns into something you can work with: consumption curves, period comparison, a meter register — in a browser, with nothing to install.
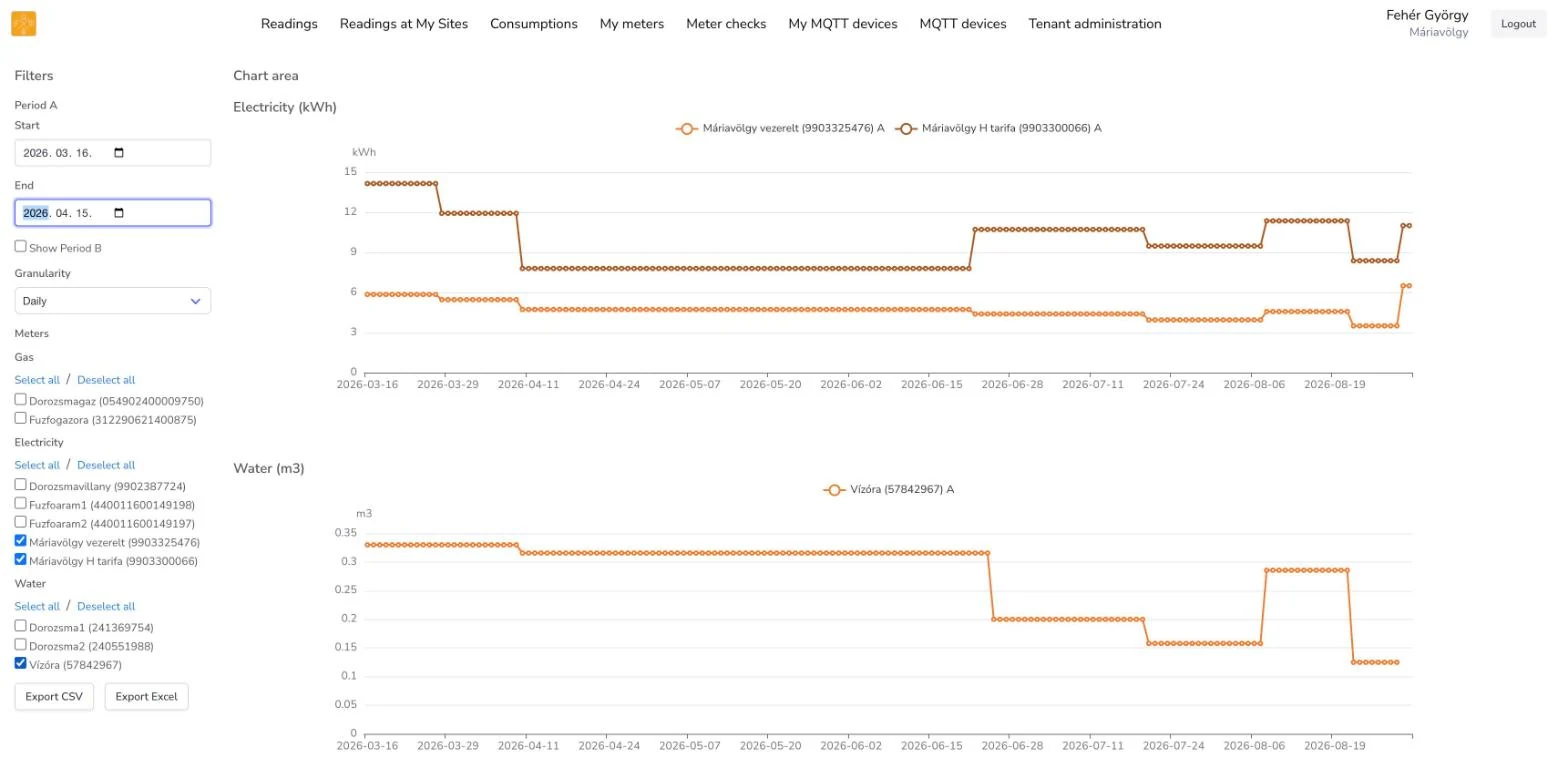
The consumption view in my.snapmeter.app — real data, two electricity meters and a water meter at daily granularity.
Consumption curves by energy type
Electricity, water and gas on separate charts, coloured per meter — not a table someone still has to interpret.
Compare two periods
Pick a period, switch the second one on, and the two are drawn over each other. That is what shows you what this month looked like last year.
Daily, weekly or monthly
The same data at three resolutions. The daily curve shows the weekend; the monthly one shows the trend.
Filter meters and sites
Select the meters you care about. One building, one energy type, or the whole portfolio at once.
Meter register
Add a meter, edit its details, record a replacement — the register sits in the same place as the data.
Seal checks
Seal states recorded in the field, in their own view, searchable afterwards.
A finished system, not a development project.
Snapmeter is not a reading app but a complete energy monitoring system: mobile app, backend, storage, analysis and integration in one. Not an OCR library you have to build something around — after rollout the whole process runs.
Full meter lifecycle
Every meter in one place, from installation through replacement to decommissioning — the swap itself, its date, and both old and new readings are recorded.
Task assignment and deadlines
Reading periods, owners, reminders. You can see which site is done and which is not — before the month closes.
Role-based access
Each person sees and reads only the meters assigned to them. Head office sees all of them.
Automatic error filtering
Obviously wrong values — a mistyped digit, a wrong order of magnitude, a reading lower than last month — are stopped before submission, not after.
A photo and a seal check with every reading
Every value carries the image it was read from, and the state of the meter’s seal is recorded alongside it. A broken seal is reported on the spot — the technician is already standing there, so no second visit is needed.
Works offline
Readings can be taken in a basement or a pit with no signal; the data syncs when the phone sees a network again.
Web portal and export
Everything is reachable from a browser at my.snapmeter.app and can be exported to CSV or XLSX at any time — or pushed on into SAP and your BI tools.
Try it first. Then let’s talk about price.
Snapmeter is free to download and stays free for 5 meters — enough to settle whether it reads your meters. Once there are several sites and several people doing the readings, that is where the conversation starts.
A few buildings, a few dozen meters
- Automatic reading with photo documentation
- Web portal — my.snapmeter.app
- Consumption charts
- Works offline
For organisations with multiple sites and properties
- Unlimited meters and locations
- Task assignment, deadlines, role-based access
- Several values from one meter (tariff registers)
- Seal check and audit trail
- SAP, Power BI, Tableau, Metabase integration
- Dedicated rollout support
Pricing follows from the number of meters and sites and the depth of integration. Snapmeter is free up to five meters; above that we quote individually.
What does collecting your readings cost you today?
Not the time spent reading them — that stays. The work that follows: typing the notes up, consolidating them, chasing what is missing.
- 1.5 minutes of admin per meter per cycle: noting it on site, typing it up later, checking it.
- A further 15 minutes per site per cycle: collecting, formatting, chasing missing readings.
- With Snapmeter 0.2 minutes per meter remain — approving the value before submission. The per-site consolidation disappears.
- Time on site is unchanged and is not counted. Snapmeter replaces the work that follows the walk, not the walk.
- The currency selector changes the label only — the arithmetic uses your own hourly cost, with no exchange rate in it.
- The default hourly cost is the full employer cost of a typical field worker: gross pay plus contributions, spread over roughly 168 working hours a month. If an office colleague does the paperwork, the figure is higher — replace it with your own.
Frequently asked questions
Every location, every meter,
automated.
Book a 30-minute call and we will show you how Snapmeter would work for you — no commitment, no sales pressure. Or try it on your own meters first.
Thank you — we have it.
We will reply to the address you gave within one working day with a proposed time.